
Australia’s current economic situation lies in an awkward position of balancing persistent inflation levels and a tight labour market with weak economic activity and private sector spending. Whilst the recent December quarter’s 2.4% headline inflation figure (VS September’s 2.8%), coupled with the easing of underlying inflation to 3.2% precipitated February’s rate cut decision, this by no means spells the end of inflation troubles.
Figure 1: Consumer Price Index
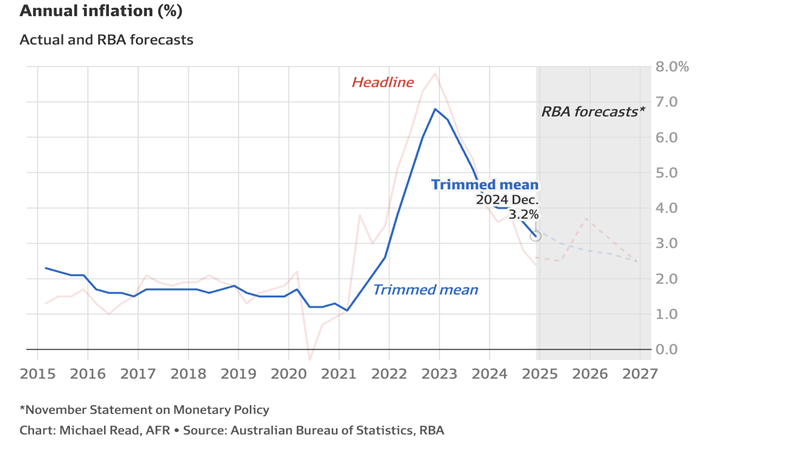
The overarching objective of the RBA is to sustainably attain an underlying inflation at the 2.5% mark when excluding the temporary, one-off price reductions captured by headline (e.g. recent government electricity rebates). That means that until the RBA can be reliably assured that underlying inflation can sustainably hit the intended 2.5% target, it will not proceed with any further cuts. Unfortunately, looking forward, this appears to be a difficult task.
Firstly, the mix of a tight domestic labour market and its corresponding weak productivity growth, and the uncertainty in the global outlook with tariffs, trade wars and geopolitical conflicts will make the Reserve Bank extremely cautious proceeding with further rate cuts.
Moreover, we see clear signs that getting underlying inflation down to 2.5% will be a much more difficult task than expected. We at VMG conducted our own research to realise that there exist systemic drivers of inflation, not so much from the demand-side as everyone scrutinises on, but on the supply-end of the economy, driving up the price of production across the country, flowing through to the CPI
Looking at inflation, the cost of construction has both direct and indirect influences on the Consumer Price Index, affecting housing (21.74% of CPI weighting) and transport (11.42%). However, whilst the CPI does capture material price increases for consumers, it does not detail the reason for these price rises, one of which being the cost of production.
Instead, the Producer Price Index (PPI) measures the change over time in prices from the perspective of the producers – in which increases in the price of inputs will invariably flow on to affect final prices.
Figure 2 – Producer Price Index – Input to House Construction Prices
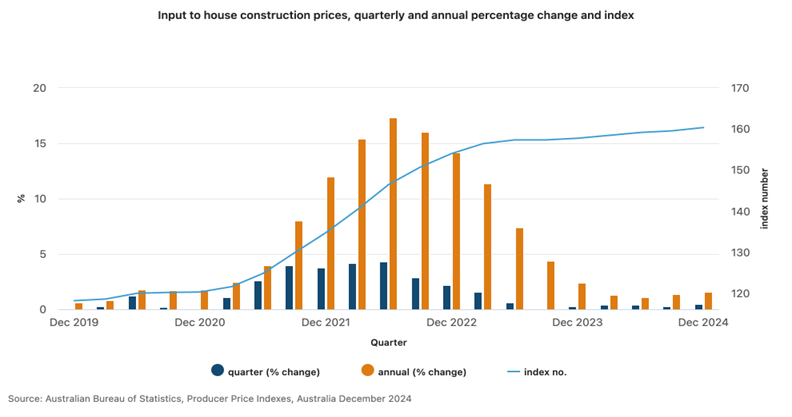
Whilst overall, the cost of housing inputs have normalised from the global supply chain disruptions of 2022 (as per Figure 2), with a 1.6% year-on-year increase in Dec 2024, certain items have persisted in price escalations, keeping broader construction prices elevated – the most significant of which is concrete.
As the second most used substance in the world after water and with usage twice the weight of steel, wood, plastic and aluminium combined, concrete is the most prevalently used construction material in the world and Australia.
Concrete and related expenses (such as transportation) comprise 10-15% of the total construction budget for a residential property, and around 22% of a standard industrial warehouse project, used for foundations, slabs, driveways and structural elements.
It follows that a change to the price of concrete has significant flow-on effects to the cost of construction, and hence, inflation.
Figure 3: Cost of a Standard 300 000 Sqrm Warehouse ($/sqm)
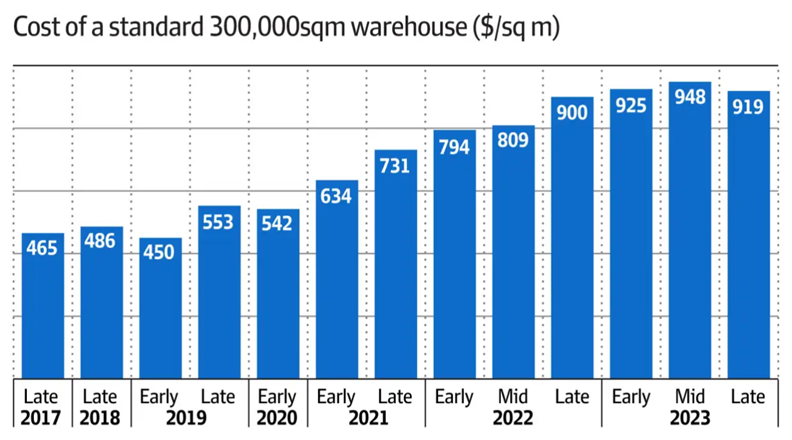
Source: AFR | Texco Construction
Alarmingly, concrete leapt from $84 per installed on-site square metre in early 2020 to $130 in mid-2023 (over 50%), driven by the cost of sourcing raw fibrous cement alongside elevated labour, energy and freight costs. It followed that the rise of concrete prices accompanied an increase in residential building construction prices by 5.3% in the year leading up to September 2024.
What factors have contributed to the increase in concrete prices
Of the inputs to the production of concrete, some costs lie out of our control whilst others have the potential to be addressed. Concrete is made by combining cement, water and aggregates such as sand and gravel. The cost of concrete relies not only on the price of the raw materials but also depends on the cost of transporting it to our cities.
Cost of Cement
The price of cement is relatively shielded from disruptions to global supply chains, with imports comprising only 10-15% of the total usage in 2021.
Instead, NSW’s cement supply is primarily produced internally, with companies like Boral and Cement Australia operating manufacturing facilities which heat limestone and other materials in kilns as part of the manufacturing process.
The process of producing cement is highly energy-intensive, consuming about 100 kilowatt-hours (kWh) of electricity per tonne of cement, used for operating the heavy machinery involved in processing raw materials (such as limestone and clay). Similarly, natural gas and coal is typically used to generate the high temperatures required in kilns, requiring around 3.6 gigajoules (GJ) per tonne of clinker produced.
Between 2021-2023, the average wholesale electricity price in the National Electricity Market (NEM) grew from around $52 per megawatt-hour (MWh) to $157 per MWh, whilst the average gas price rose from around $6.50 per GJ to $12.50.
This significantly contributed to the rise in cement prices by 5.9% in the year leading up to June 2024, as shown in Figure 4.
Figure 4: Change in Price of Inputs to House Construction
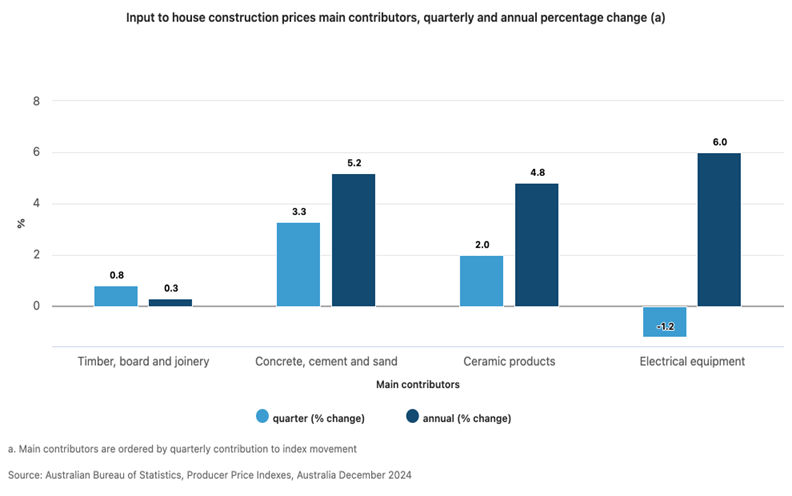
Like cement, aggregates such as sand, gravel and crushed stone, are primarily sourced from local quarries across New South Wales, and are subsequently transported to Sydney to support urban construction projects. This is due to Australia’s abundant natural resources, with their low cost and high weight largely resulting in the local servicing of geographic regions rather than imports.
However, in recent times, environmental regulations and land use policies have restricted the expansion of existing quarries and the establishment of new ones, particularly closer to Sydney. For example, the Martins Creek Quarry in the Hunter Region saw its proposal to expand its production capacity and operational lifespan rejected by the NSW Independent Planning Commission (IPC) in February 2023, citing the impact of increased truck movements, noise and safety concerns on the local community.
Among others, these regulatory challenges have increased operational costs, affected the local supply of aggregates, and increased Sydney’s reliance on aggregate transported from more distant locations.
Given that sand represents roughly 30% of a cubic metre of concrete, the recent impact of regulation, coupled with the significant decline in sand and aggregate reserves since 2020, have seen producers crush sandstone to create fine sand. This has resulted in the price of sand, as a key input of concrete, rising at over 10% p.a compounding, to around $106 per tonne.
Another of the more significant inputs to the cost of concrete is transportation, which is currently the primary source of transportation for aggregate into Sydney. Transportation costs can contribute anywhere from 10% to 20% of the total cost of concrete production, depending on the distance and the logistics involved, with further distances creating higher fuel usage, driver wages, and logistical expenses.
Sydney currently sources its construction aggregates from multiple regions to meet the city’s substantial demand, with the primary locations being the Shellharbour area, the Central Coast and the Hunter Region.
However, given the high fuel consumption and lower efficiency of 30 tonne trucks, this medium of transport is much more expensive than alternatives such as rail and shipping especially over long-haul distances, further contributing to price escalation. This is not to mention the negative externalities such as increased congestion on roads, noise pollution and greater greenhouse gas emissions.
Forward Outlook on Concrete
Looking forward, the price of concrete will continue to have a large influence on the economy, with current prices already impacting the viability of projects according to Texco director Tom Bull.
As we begin to see the normalisation of interest rates and investment activity, demand for construction and concrete is only set to increase.
For example, NSW has experienced a surge in infrastructure development proposals in recent years. The State Government’s 2022–23 State Infrastructure Plan outlines a record infrastructure pipeline of $112.7 billion over the next four years, encompassing major projects such as the Sydney Metro expansion, the Western Sydney Infrastructure Plan, and various road and rail upgrades.
Additionally, the NSW Government has committed to building 377,000 new homes over the next five years. This ambitious housing target is expected to further amplify the demand for construction materials, including concrete, as the state works to address housing shortages and accommodate population growth
Overall, with the pipeline of infrastructure projects set to elevate the demand for concrete, it is increasingly imperative that Sydney finds a way to produce concrete cheaper and in greater quantities, addressing the cost of sourcing and transportation.
In the meantime, the RBA interest-rate reductions will continue to be stalled by persistent producer price inflation. We don’t see a solution occurring any time soon so we think inflation and higher interest rates are going to be around for a lot longer.
RBA Interest Rates Will be Stuck Higher for Longer – Here is Why
The RBA has repeatedly reiterated that it will not lower interest rates until it is convinced inflation can stay sustainably within the 2-3% target range. However, despite the September Quarter headline inflation falling to a 3.5 year low of 2.8%, underlying inflation (which disregards temporary, one-off events such as recent government electricity bill relief) rose by 0.3% to 3.5% in October- well above the target.
VMG has undertaken a review of the underlying causes of inflation and discovered construction materials is one of them. NSW and other states are currently faced with double digit producer price inflation for construction materials due to systemic issues beyond the control of the RBA.
As the most prevalently used construction material in the world and Australia, concrete comprises around 10-15% of the total construction budget for a residential property, and around 22% of a standard industrial warehouse project.
Alarmingly, concrete leapt from $84 per installed on-site square metre in early 2020 to $130 in mid-2023 (over 50%), which contributed to a 5.3% increase in residential building construction prices last year.
What factors have contributed to the increase in concrete prices?
Concrete is made by combining cement, water and aggregates such as sand and gravel.
The process of producing cement is highly energy-intensive, consuming about 100 kilowatt-hours (kWh) of electricity per tonne of cement. Between 2021-2023, the average wholesale electricity price grew from around $52 per megawatt-hour (MWh) to $157 per MWh.
Given that sand represents roughly 30% of a cubic metre of concrete, the recent impact of regulation, coupled with the significant decline in sand and aggregate reserves since 2020, has seen sand rising at over 10% p.a. compounding, to around $106 per tonne.
Further, transportation costs can contribute anywhere from 10% to 20% of the total cost of concrete production
However, given the high fuel consumption and lower efficiency of 30 tonne trucks, this medium of transport is much more expensive than alternatives such as rail and shipping especially over long-haul distances, further contributing to price escalation.
Looking forward, as we begin to see the normalisation of interest rates and investment activity, demand for construction and concrete is only set to increase. When coupled with the NSW government’s pipeline of infrastructure projects, it is increasingly imperative that we find a way to produce concrete cheaper, addressing the cost of sourcing and transportation.
In the meantime, the RBA interest-rate reductions will continue to be stalled by double digit producer price inflation. We don’t see a solution occurring any time soon so we think inflation and higher interest rates are going to be around for a lot longer.
Recent Comments